Your sell-through rate is the percentage of your inventory sold to customers in a given period.
Often calculated monthly, sell-through rates help show sales trends and how different styles and sizes of the same product fare against each other.
If you want to know your customers better and minimize overstocking, calculate your sell-through rate regularly.
What is sell-through rate?
A sell-through rate (STR) is a key performance indicator (KPI) that measures the percentage of inventory sold in relation to the number of units received from manufacturers during the same period.
For performance, your STR is the measurement of monthly sales against a given target. Measuring your STR can help you track sales data, adjust your goals, and keep your supply chain efficient.
Though sell-through rates vary from industry to industry, the benchmark STR is at or above 80%.
Why sell-through rate is a critical metric for profitability
Of all the retail metrics you can track, sell-through rate is one of the most important for retail businesses. Consistently tracking STR in your retail reports can reveal key insights into profitability.
Here are five reasons why it is useful to calculate your STR:
- Identify product demand and popularity
- Reduce carrying costs and prevent overstock
- Optimize supply chain and supplier relationships
- Measure marketing campaign effectiveness
- Improve cash flow and financial forecasting
1. Identify product demand and popularity
Your STR is not just a single blanket measurement of overall sales. Retailers often calculate multiple STRs by supplier, product line, store location, and more.
STR can offer valuable insight into which types of products are most popular. A high sell-through rate indicates that a product is selling well. This information can be used to optimize inventory and better judge customer demand.
2. Reduce carrying costs and prevent overstock
A low sell-through rate indicates that your inventory management needs improvement and that you’re likely storing more than you need. Use your STR to better understand how you can save on storage costs.
Overstocking is expensive, especially if your stock expires quickly or goes out of season. Storing excess inventory also takes up space that could be used for in-demand products.
To determine if stocking up is worth it, consider storage costs against expected shipping costs and profit loss from stockouts.
3. Optimize supply chain and supplier relationships
Modern supply chains are complex and prone to unexpected delays. Many retailers compensate by overordering before understanding which products will actually sell.
A clear understanding of your sell-through rate allows you to work proactively with suppliers and maintain optimal stock levels, even during periods of disruption.
STR provides clarity on trending sales, so you can work with your suppliers to order the right products ahead of time, focusing on high-selling items.
4. Measure marketing campaign effectiveness
Every retailer has sales goals. They help you track overall store performance, hold your sales associates accountable, and motivate your team. Many retailers visualize this data on a store performance dashboard to get a quick overview of sales goals.

Your STR helps you measure your monthly revenue and identify opportunities to increase sales by supplier, product line, store location, sales channel, and more. STR can be used to measure sales through any lens and better understand how different parts of your retail or ecommerce business are performing.
5. Improve cash flow and financial forecasting
Your STR is another way to examine your revenue against the cost of your inventory.
An STR that drops tells you that you’re spending more money than you’re making, while a growing STR means that your profit margin is rising and will continue as you adjust your inventory orders and storage costs.
How to calculate your sell-through rate
To calculate your sell-through rate, you need the number of units sold during the month, and the total amount of stock available for sale that month.
You can also calculate your STR annually, quarterly, or weekly depending on your sales goals.
Sell-through rate formula
Use this formula to calculate your sell-through rate:
(Total sales / Stock on hand) x 100 = % Sell-through rate
💡 PRO TIP: Skip the manual calculations and view Shopify’s Product sell-through rate report to see the percentage of your total inventory you’ve sold during a given period.
Sell-through rate example
Let’s look at how you would calculate the sell-through rate on a new product and use the information to make a decision on adjusting your inventory.
Say you own a coffee shop and want to start selling cupcakes. For September, you order 1,000 cupcakes, 200 each of five different flavors: vanilla, chocolate, red velvet, carrot, and birthday cake.
At the end of the month, you calculate your sell-through rate to understand how much your customers liked the cupcakes. You learn that of the 1,000 cupcakes, you sold 800.
(800 / 1,000) x 100 = % sell-through rate
0.8 x 100 = 80%
In September, your cupcakes had an overall 80% sell-through rate—so far, so good.
Next, you’re curious how your customers liked each flavor. Red velvet, carrot, and birthday cake are more expensive than the others, so you only want to order those that will sell.
You take the number of sales for each flavor and divide each by 200, the total number ordered:
- Vanilla: (190 / 200) x 100 = 95%
- Chocolate: (180 / 200) x 100 = 90%
- Red velvet: (175 / 200) x 100 = 87.5%
- Carrot: (100 / 200) x 100 = 50%
- Birthday cake: (125 / 200) x 100 = 62.5%
According to September’s sell-through, vanilla and chocolate were the most popular. You’ll order 200 each for next month. Red velvet was also a hit, so you’ll order 200 of those, too.
The carrot flavor was clearly underperforming, so you decide not to reorder any of that flavor.
While birthday cake didn’t hit your 80% STR goal, it did come close. Some customers did enjoy the flavor, so you’ll only order 100 next month. This is a great example of assortment planning. You’ve turned the sales data into actionable inventory strategies—determining which flavors to retain, which to eliminate, and which to reduce.
How to interpret your sell-through rate
What is a good sell-through rate?
As a quick gut-check, a healthy STR is in the 70%–80% range for your in-period assortments. However, the right target will always depend on your product category, its life cycle, and the time window you're measuring.
There are always caveats:
- For short-life or seasonal drops, like limited-run fashion, aim for a >80% STR within the launch window. This is because your ability to replenish is limited, and the markdown risk increases the longer the items remain unsold.
- For evergreen and core products, a lower STR of 40%–60% per month or quarter is acceptable, only as long as your inventory turns are on plan and your profit margin is protected.
Sell-through rate benchmarks by industry
Within the retail industry, a good sell-through rate can look very different from one product category to another.
The benchmarks below illustrate how the pace of sales can fluctuate over time for various product types:
- Fragrance: A typical sell-through rate is around 23% after 8 weeks, growing to 63% after a full year.
- Cosmetics: Sell-through for cosmetics is often around 25% after 8 weeks and 48% after 52 weeks.
- Home improvement: This category moves much faster, with sell-through rates around 55% in the first 8 weeks and 90% within a year.
Note: These benchmarks are illustrative. Your targets should always be set based on your specific product mix and your buyers' expectations.
The impact of time and seasonality
Context is everything when interpreting your sell-through rate. Be sure to compare similar time frames. When judging sales performance, always compare like-for-like periods to get an accurate picture.
Major events like holidays, back-to-school season, and even weather can significantly lift or lower sales. Use your historical data and look at monthly retail trade trends for your industry to set realistic goals during these peak periods.
Sell-through rate vs. inventory turnover
Sell-through rate and inventory turnover both help you understand how inventory is performing. But they serve different purposes:
- Sell-through rate measures the performance of one specific product or a single collection. It tells you what percentage of that item you sold in a certain amount of time (typically a month).
- Inventory turnover provides a bigger picture of overall business health. It shows how many times you sold and replaced all of your products over a longer period, usually a full year.
The main reason to track inventory turnover is to see how efficiently your business is using its money.
High turnover means your money isn't just sitting on a shelf in the form of unsold products—you are turning your stock back into cash quickly. That cash flow lets you reinvest in your business by restocking your most popular products.
When to use each metric
- Use sell-through rate when you need to evaluate a single product in the short term. It’ll answer questions like, "Are people actually buying the new jackets we launched last week?"
- Use inventory turnover to assess the long-term health of your business. It answers bigger questions like, "Are we carrying too much unsold stock in general?" or "Are we using our money more efficiently this year than we did last year?"
Five strategies to improve your sell-through rate
So, you’ve calculated your sell-through and find that it’s low. Here are some ways to achieve a higher sell-through rate and improve your retail business.
1. Refine your inventory purchasing strategy
Buying too much inventory is an easy way to hurt your sell-through rate. This happens when a business lacks clear inventory reporting, and they are forced to make purchases without accurate data. In July 2025, US retailers had about $810 billion in unsold products, which shows how big this problem is.
Using smart retail technology like AI can help you get much better at predicting what customers will buy. According to McKinsey, AI-driven planning in distribution operations is associated with 20%–30% lower inventory levels via better forecasting and optimization.
💡Tip: Use Stocky by Shopify to forecast demand and create purchase orders. It analyzes your real-time sales data to help you make informed decisions on what and how much to buy. That way, you’re less likely to be surprised by a sudden sellout of a popular item or get stuck with a warehouse full of products nobody wants.
2. Run strategic promotions and discounts
Offering sales and discounts can help you sell products faster without making your brand look cheap.
Research from NIQ shows that even a tiny 1% improvement in your pricing can boost your profit margins by about 11%, as long as you use data to plan your discounts. It’s all about offering the right deal at the right time.
“While markdowns are a quick way to enhance inventory turnover, generate cash, keep fresh goods flowing, and remedy purchasing mistakes, they should solve problems rather than create new ones,” says Gerrid Smith, CMO at Joy Organics.
While this approach can boost sales, it also reduces profit margins. Discounts and promotions should be applied sparingly and you should always keep your break-even point in mind when running them.
“Before you start mass discounting at a percentage that appeals to you, make sure you’ve calculated how much of a blow your margin will suffer once you’ve put a sale figure on it,” says Gerrid. “A 2% reduction in markdowns results in a profit increase of nearly 1%.”
You can easily create discounts right from your Shopify admin. For example:
- A “Buy one, get one 50% off” deal on a slow-moving T-shirt
- Free shipping for orders over $100 to increase basket size
- A special 15% discount just for your VIP customers on select items
If you need to create more complicated deals with special rules, you can use Shopify Functions to build them.
3. Use product bundling to move slow-selling stock
Product bundling is when you sell several items together as a package. It's a great way to get customers to buy more and to sell items that aren't moving quickly on their own.
Studies from The Journal of Retailing and Consumer Sciences confirm that bundles increase the number of items people buy at once and can help you sell products faster. But creating bundles is difficult because you have to keep track of inventory and avoid overselling.
This is where the free Shopify Bundles app comes in. As a Shopify-developed tool, it integrates directly into your admin, allowing you to start creating fixed bundles and multipacks.

When a customer buys a bundle, the app automatically reduces the stock count for both the specific shirt and shorts variants sold. Customers can choose from options like size or color for the products within the bundle, just as they would for a regular product.
4. Increase product visibility with targeted marketing
You can't sell what customers don't see, but simply getting more eyes on your products isn't enough. You need to get them in front of the right customers.
A 2024 report from Boston Consulting Group found that retailers leading in personalization grow revenue 10% faster than their competition, and linking recommendations to real-time inventory can lift sell-through by 10%. Traditional digital advertising is expensive and often targets broad audiences, leading to wasted ad spend and a low return.
Shopify Audiences lets you export algorithm-generated Retargeting Boost lists to Meta, Google, TikTok, and other platforms, doubling retargeting-driven orders and cutting customer-acquisition costs by up to 50%.
👉Case study: Formalwear label Mac Duggal grew their retargeting pool 2.3x and lowered cost per purchase 3.6x after adopting Shopify Audiences.
5. Leverage your data for demand forecasting
Seasonal demand creates volatility in retail. You know your products have peak seasons, but it’s hard to turn that observation into a purchasing plan. A specific coat may have sold out last winter, but deciding how many to reorder and when is often a matter of guesswork.
Shopify Analytics shows you exactly what products sold and when, and Stocky uses that information to show you what to buy next. For example, Analytics can show that you sold through 500 units of a specific coat last November. Stocky then takes that sales velocity, factors in your supplier’s lead time, and recommends ordering 600 units in September to be ready for the winter rush.
This allows you to better plan inventory and make sure the right products are in stock when customers are ready to buy.
Sell items faster by optimizing sell-through rates
Keep an eye on your inventory data and prioritize these sell-through strategies when you see merchandise sales slow down. Use your sell-through data to prepare for quick reorders for trending products.
Remember: Proactivity means better profits. Armed with your sell-through rate and a motivated sales team, you can improve retail sales quickly.
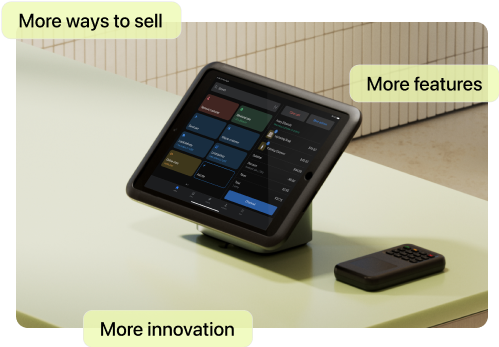
To calculate your STR, however, you’ll need accurate data and a platform to easily capture it. See how Shopify POS may be the platform you need for your sell-through needs.
Sell-through rate FAQ
What does sell-through rate mean?
Your sell-through rate is the amount of inventory sold during a given time period out of the amount of inventory received.
How do you calculate sell-through rate?
The formula for calculating your sell-through rate is: Sell-through rate = (Total sales/Stock on hand) x 100
What is a good sell-through rate?
Try to aim for a sell-through rate of at least 80%. Your sell-through rate may be different depending on your retail category, season, and the period of time you are measuring.